Great article and a very useful resource. The key point is that hate crimes against Jews are classified by the police as religious hate crimes, while those against Muslims are split between two categories, religious- and race-based hate crimes, with the great majority of cases in the latter.
Its doubtful if those attacking (presumed) Muslims verbally or physically separate out their motivations. But what is clear is that Jews per capita experience an order of magnitude less attacks.
The spin machine claiming otherwise is of course part of the campaign that also tries to undercut criticism of Israel by claiming it is motivated by antisemitism. Jews are to be understood as victims.
9
0
Well done JVL. Brilliant article.
Benedict Anderson (Imagined Communities) made the point regarding print capitalism. …media controls and shapes people not through direct force but by constructing their ‘shared’ sense of reality and political ‘identity’.
The power of print!
“Facts get their importance from what is made of them in interpretation… for interpretations depend very much on who the interpreter is, who he or she is addressing, what his or her purpose is.” Edward Said
5
0
Thank you for this informative review. There currently an effort across the media to present the idea of Jews under siege from antisemitic violence. The lack of concern for groups which suffer a higher per capita level of hate crimes reveals the political motivations behind the exaggerated reporting. This article will help us all to respond to that on the basis of the facts.
9
0
Hi Alan,
I was wondering whether you could provide an explanation of how you came to the 3/4 figure?
This a very welcome article but does seem to have to this topic a bit late. After the 2014 bombing of Gaza – 551 children killed along with 2000+ adults – I did a media representation case study of the story of a Jewish lad badly hurt in a gang in Manchester. Originally reported as ‘drug related’ by The JC, it was taken down and re-spun as an anti-Semitic attack across the media for many months despite the Police, DPP, and Judge saying otherwise. There were similar listed cases around this time. See Arena ‘Anti-Semitism Moral Panics’. https://arena.org.au/anti-semitism-moral-panics-by-gavin-lewis/
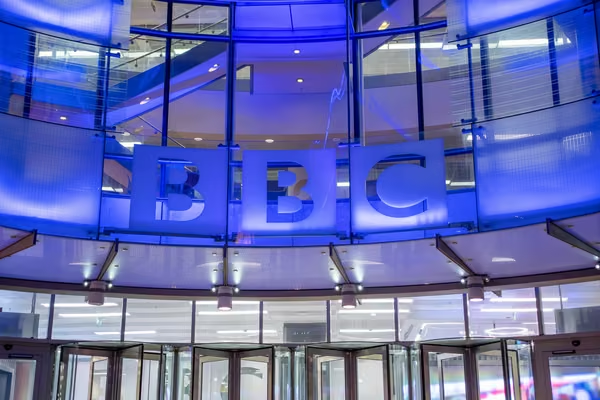
Frequently too by comparison Black victim experiences are frequently labelled merely ‘alleged racism’ – if at all. Whereas anti-Semitism allegations seems to require little corroboration. There is also the issue of like-for-like standards. BBC online recently reported “Jewish man ‘kicked like animal'”. Leaving aside the tabloid imagery of kicking animals as a British norm, actually he was an Israeli. Would anyone have reported the religion of a white South African or Rhodesian hurt in a revenge attack – and those colonial projects had armed revolutionary resistance movements.
0
0
Thank you for a very useful article, that put things in perspective.
Still there is antisemitism and probably increasing thanks to Israel’s best efforts.
Although, it is good to know that the scale is being exaggerated, for the individual Jew at the receiving end, the hurt and harm is very real.
In the same way that Islamophobia, or racism in every form, is very real to the individuals and groups that experience it.
Statistics are useful up to a point.
0
0
Btw it is also worth mentioning the comparative ease with which so-called anti-Semitism dossiers are presented as establishment credible and authentically newsworthy. From memory, it might have been Saul Staniforth that critiqued one of these as ‘padded’. But the real issue is that if you’re from an oppressed group – particularly of people of colour – you’re not likely to be going to the authorities, Police who shoot-to-kill, beat, disproportionately stop and imprison you, the Education authorities who strip-search your children, or the Health Managers who marginalise your complaints and treatment. Parts of the media are even suggesting Housing authorities should be privileging indigenous Britons? By comparison look at the massive advantage in access, networking, lobbying and uncritical acceptance of claimed anti-Semitism grievances of Israel’s lobby. And significantly these advantages are hardly ever equivalently enjoyed even by non-Zionist or anti-Zionist Jews.
2
0
This is important – the exaggeration of victimhood is deliberate. From my own experience I have rarely witnessed any antisemitism but frequently here condemnations of ‘Muslims’.
2
0
I think the headline is unfortunate because it makes this careful analysis seem biased and denialist. It’s therefore hard for me to use the findings, even though I believe them entirely and can see the facts on the ground every day where I live.
0
0
The following query was posted on a thread elsewhere on the web:
“Do you know where they got the figure that 3/4 non-white victims of religious hate crimes are miscategorised under race? There isn’t really a basis for this explained or a linked article. ”
Alan Maddison replies:
Under Fig 4 of an earlier article based on the previous CSEW data set, I show Muslim hate crimes under the strand of Religion as a share of the combined religious and racial hate crimes as 3.5% in police reports and while the CSEW estimate was 14%. This suggested an undercount of 1 in 4 (3.5/14) for Muslims under this strand. The most recent CSEW data set period to March 2025 gives a similar ratio between police and CSEW shares.
But I then took another additional approach.
The Police strand of Religious hate crime totaled 10,065 offences, and the CSEW reported 38,000 offences which adjusted (-18%) to an expected 31,000 offences for the police strand, just over three times higher than the actual figure of 10,065. So who were these missing victims?
We analysed published CST antisemitism incidents over this period. These cover both strands, and include non-criminal incidents. The CST numbers were very close to published police religious hate crime figures for Jews. This suggested that almost all the hate crime offences involving Jews had been registered by police under the strand of Religion. This made sense as 98% of British Jews are White, and police error based on skin colour would be minimal, so no under-reporting here.
So increasing the police strand of Religion three-fold to align with CSEW estimates, would be largely down to a higher than three-fold increases from non-White victims. Based on our estimates of their number this worked out to represent a 4.4 fold increase.
The indicative police ethnicity data tend to support this hypothesis (see footnote 4).



Great article and a very useful resource. The key point is that hate crimes against Jews are classified by the police as religious hate crimes, while those against Muslims are split between two categories, religious- and race-based hate crimes, with the great majority of cases in the latter.
Its doubtful if those attacking (presumed) Muslims verbally or physically separate out their motivations. But what is clear is that Jews per capita experience an order of magnitude less attacks.
The spin machine claiming otherwise is of course part of the campaign that also tries to undercut criticism of Israel by claiming it is motivated by antisemitism. Jews are to be understood as victims.
Well done JVL. Brilliant article.
Benedict Anderson (Imagined Communities) made the point regarding print capitalism. …media controls and shapes people not through direct force but by constructing their ‘shared’ sense of reality and political ‘identity’.
The power of print!
“Facts get their importance from what is made of them in interpretation… for interpretations depend very much on who the interpreter is, who he or she is addressing, what his or her purpose is.” Edward Said
Thank you for this informative review. There currently an effort across the media to present the idea of Jews under siege from antisemitic violence. The lack of concern for groups which suffer a higher per capita level of hate crimes reveals the political motivations behind the exaggerated reporting. This article will help us all to respond to that on the basis of the facts.
Hi Alan,
I was wondering whether you could provide an explanation of how you came to the 3/4 figure?
Best,
Joshua Alston
The answer is posted below, here: https://jewishvoiceforliberation.org.uk/article/are-hate-crimes-against-jews-being-deliberately-exaggerated/#comment-55116
This a very welcome article but does seem to have to this topic a bit late. After the 2014 bombing of Gaza – 551 children killed along with 2000+ adults – I did a media representation case study of the story of a Jewish lad badly hurt in a gang in Manchester. Originally reported as ‘drug related’ by The JC, it was taken down and re-spun as an anti-Semitic attack across the media for many months despite the Police, DPP, and Judge saying otherwise. There were similar listed cases around this time. See Arena ‘Anti-Semitism Moral Panics’. https://arena.org.au/anti-semitism-moral-panics-by-gavin-lewis/
Frequently too by comparison Black victim experiences are frequently labelled merely ‘alleged racism’ – if at all. Whereas anti-Semitism allegations seems to require little corroboration. There is also the issue of like-for-like standards. BBC online recently reported “Jewish man ‘kicked like animal'”. Leaving aside the tabloid imagery of kicking animals as a British norm, actually he was an Israeli. Would anyone have reported the religion of a white South African or Rhodesian hurt in a revenge attack – and those colonial projects had armed revolutionary resistance movements.
Thank you for a very useful article, that put things in perspective.
Still there is antisemitism and probably increasing thanks to Israel’s best efforts.
Although, it is good to know that the scale is being exaggerated, for the individual Jew at the receiving end, the hurt and harm is very real.
In the same way that Islamophobia, or racism in every form, is very real to the individuals and groups that experience it.
Statistics are useful up to a point.
Btw it is also worth mentioning the comparative ease with which so-called anti-Semitism dossiers are presented as establishment credible and authentically newsworthy. From memory, it might have been Saul Staniforth that critiqued one of these as ‘padded’. But the real issue is that if you’re from an oppressed group – particularly of people of colour – you’re not likely to be going to the authorities, Police who shoot-to-kill, beat, disproportionately stop and imprison you, the Education authorities who strip-search your children, or the Health Managers who marginalise your complaints and treatment. Parts of the media are even suggesting Housing authorities should be privileging indigenous Britons? By comparison look at the massive advantage in access, networking, lobbying and uncritical acceptance of claimed anti-Semitism grievances of Israel’s lobby. And significantly these advantages are hardly ever equivalently enjoyed even by non-Zionist or anti-Zionist Jews.
This is important – the exaggeration of victimhood is deliberate. From my own experience I have rarely witnessed any antisemitism but frequently here condemnations of ‘Muslims’.
I think the headline is unfortunate because it makes this careful analysis seem biased and denialist. It’s therefore hard for me to use the findings, even though I believe them entirely and can see the facts on the ground every day where I live.
The following query was posted on a thread elsewhere on the web:
“Do you know where they got the figure that 3/4 non-white victims of religious hate crimes are miscategorised under race? There isn’t really a basis for this explained or a linked article. ”
Alan Maddison replies:
Under Fig 4 of an earlier article based on the previous CSEW data set, I show Muslim hate crimes under the strand of Religion as a share of the combined religious and racial hate crimes as 3.5% in police reports and while the CSEW estimate was 14%. This suggested an undercount of 1 in 4 (3.5/14) for Muslims under this strand. The most recent CSEW data set period to March 2025 gives a similar ratio between police and CSEW shares.
But I then took another additional approach.
The Police strand of Religious hate crime totaled 10,065 offences, and the CSEW reported 38,000 offences which adjusted (-18%) to an expected 31,000 offences for the police strand, just over three times higher than the actual figure of 10,065. So who were these missing victims?
We analysed published CST antisemitism incidents over this period. These cover both strands, and include non-criminal incidents. The CST numbers were very close to published police religious hate crime figures for Jews. This suggested that almost all the hate crime offences involving Jews had been registered by police under the strand of Religion. This made sense as 98% of British Jews are White, and police error based on skin colour would be minimal, so no under-reporting here.
So increasing the police strand of Religion three-fold to align with CSEW estimates, would be largely down to a higher than three-fold increases from non-White victims. Based on our estimates of their number this worked out to represent a 4.4 fold increase.
The indicative police ethnicity data tend to support this hypothesis (see footnote 4).
I hope this answers your query.