
Is the scale of anti-Muslim hate crime being grossly understated?
JVL Introduction
Surveys indicate that Muslims suffer one of the highest levels of prejudice in Britain. It is therefore puzzling that, according to Police statistics, the total hate crimes against Muslims are much lower than would be expected.
Is this because such manifestations are really relatively infrequent for Muslims? Or are Muslim hate crime victims less inclined to inform the police? Perhaps when they do there is poor recording of their religion by police staff? Or is it something else?
In his article for JVL, Dr Alan Maddison undertakes an interesting quantitative analysis of the most recent victim-based hate crime surveys in order to try to answer these important questions.
Note: This article was reformatted on 19 Jul 2026 but the text remains unchanged.
Introduction
Islamophobia has been tolerated and even normalised by some on the assumption that it is founded on a legitimate criticism of the religion of Islam.
However, Islamophobic abuse and discrimination is usually motivated by negative stereotypes regarding the alleged collective influence of Islam on the behaviour and values of Muslims. As with all ‘otherisms’ this prejudice is unacceptable and denies Muslim diversity and individualism.
But anti-Muslim prejudices involve more than religion.
In a recent academic report, Stephen H Jones and Amy Unsworth presented convincing evidence and arguments that,
“…there are two distinct, but overlapping, types of Islamophobia, one that corresponds to other forms of racism and another that is better understood as anti-religious prejudice.”
Each can have distinct or overlapping associated negative stereotypes which have been clearly debunked here
Jones and Unsworth asserted that Islamophobia can’t be understood or fought without both these forms of prejudice being acknowledged. In this article I would like to show how failure to do this when assessing hate crime statistics may lead to a gross under-estimate of the scale of what I prefer to term more broadly as anti-Muslim hate.
The most frequently referenced data in the important fields of politics and the media is found in the annual Home Office publication on Police recorded hate crimes. However, Police reports have certain limitations that are not always mentioned by those presenting the data, and these will lead to a perception of a much lower number of hate crimes against Muslims than in reality.
The other main source of hate crime statistics is the victim-based Crime Survey of England and Wales (CSEW) which can help provide a more complete picture. It covers victim subgroups under both Race and Religion and has the advantage of not being influenced by under-reporting by victims, inaccurate recording by police staff, or changes in either over time.
In May 2022 the Office for Statistics Regulation following their review into hate crime statistics wrote to the Home Office and drew attention to the difficulties in presenting police recorded hate crime data without the important context of crime survey estimates.
In this article I will compare data from both Police reports and CSEW report-based estimates in order to help better appreciate the extent and relative importance of anti-Muslim hate crime.
Police recorded hate crime reports
The latest publication of police reported hate crimes recorded 155 000 offences over the 12 months to end March 2022
These covered incidents for each of 5 motivational strands, Race, Religion, Sexual Orientation, Disability and Transgender.
Our focus will be on the first two strands, Race with 109 843 offences which accounted for 70% of all hate crime motivations, and Religion with 8730 contributing just under 6%.
Currently we are given no national breakdown of victim ethnicity or religion in the larger Race strand, so no data for Muslims. However, for the strand of Religion we are provided with a breakdown which includes Muslim victims as illustrated in Table 1.
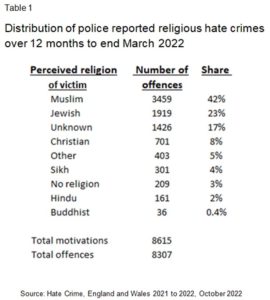
Of the 8307 recorded hate crimes motivated by Religion, 3459 (42%) involved Muslims or those perceived to be Muslim.
According to the 2021 census there are 3.9 million Muslims in England and Wales. This represents a population share of 6.5%, yet in this report Muslims were identified in only 2.9% (3459/118573) of police reported hate crimes under strands of Race and Religion.
As surveys here and here show Muslims to be subject to a higher prevalence of animosity than most other minorities, it seems that this 2.9% is probably not capturing all anti-Muslim hate crimes.
Many Muslim victims would categorise their hate crime incidents under the much larger strand of Race (as in the recent report referred to above) which can include ethnicity or cultural identities, and yet Police reports do not publish these.
In this latest police report (Section 2) we learn that from April 2021 Police began recording the ethnicity of victims of hate crimes under the strands of both Race and Religion. Their experimental data attribute around 36 000 hate crimes to Asian victims. Unfortunately the religion of victims under the strand of Race is still not recorded. However, the 36 000 Asian victims would include around 15 000 Muslim simply going by census data, a figure much higher than the 3459 reported under Religion alone.
Of course the question is whether the CSEW data can help us better understand what appears to be the huge impact of restricting Muslim identification to hate crimes motivated by Religion, but also the extent of any expected Muslim victim under-reporting or police under-recording.
CSEW victim-based hate crime reports
CSEW reports provide another important but less referenced source. These reports involve annual face to face interviews with residents from around 35 000 households. Unlike police reports the resulting data are unaffected by police under reporting / recording.
The CSEW hate crime data includes the proportion of ethnic and religious minorities surveyed who say they were victim to a hate crime motivated (or aggravated) by their Race or Religion over the previous 12 months.
As hate crimes amount to only 2-3% of all crimes identified, the Office for National Statistics (ONS) averages hate crime data from three separate annual reports to provide more robust data. The last CSEW publication covered three combined reports 2017/18, 2018/19 and 2019/20 .
In Figure 1 below we have the rates for different minority groups being victims of hate crime being motivated by race or religion. Unfortunately, Jewish, Sikh and Buddhist sample sizes were too small to provide reliable data.
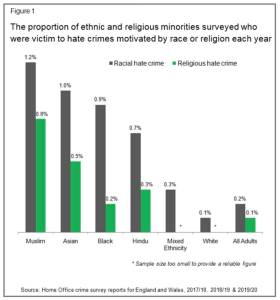
On a pro rata basis, we see Muslims were victim to hate crimes motivated by both Race (1.2%) and Religion (0.8%) more often than any other group listed.
We also observe that Muslims were more likely to fall victim to hate crimes motivated by Race than Religion.
The Race motivation for hate crimes against Muslims could be related to the colour of their skin. However, nearly 8% of British Muslims are White. and according to this TellMama Report they still represent a 7% share of anti-Muslim hate incidents. In addition, the fact that the rate for racial hate crimes for Hindus is only 0.7% suggests something else beyond skin colour is at play. It seems likely that the much higher rate for Muslims (1.2%) is related to their perceived Muslim identity. TellMAMA’s Annual Report indicate 2 out of three victims were identifiable as Muslims, more so for women who often wore a hijab or niqab. In addition during incidents victims are often addressed as Muslims. see, eg here
CSEW estimates compared with data from Police reports
The authors of the CSEW reports extrapolate hate crime rates for all adults to give totals of 104000 for Race and 42 000 for Religion. The confidence intervals around these numbers are fairly large due to possible sampling and respondent recall errors.
A direct comparison can’t be made as the CSEW estimates do not cover all hate crimes reported to Police. The CSEW surveys do not include victims under 16 or those not resident in households, and certain public order offences without a specific victim (graffiti, damage to religious buildings etc). However, a comparison with data from Police reports can still provide a useful guide to relative under-reporting and apparent recording errors.
In Figure 2 we compare these CSEW estimates with the average incident numbers from police reports over a similar three year period, see here, here and here
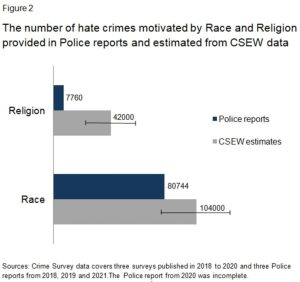
Around 47% of all victims surveyed said the police were aware of their hate crime, but this does not mean they were recorded. For all 5 strands the ratio between Police reports and CSEW estimates for this period was 1 to 1.7.
In Figure 2, for the strand of Religion the ratio is around 1 in 5, which suggests greater than average victim under-reporting and/or poor recording by police staff.
For the strand of Race the ratio is much tighter at 1 to 1.3. This indicates that police staff may have also classed under Race some, if not many; of those hate crimes that victims considered to be motivated by their Religion.
Comparisons for Muslim victims
From the CSEW rates for Muslims given in Figure 1, and estimates of the adult Muslim population at 2.6 million (see here, here and here.), we can estimate the number of hate crimes for Muslims over this period. Accepting a high margin of error, these estimates are compared with Police report data over a similar period in Figure 3.
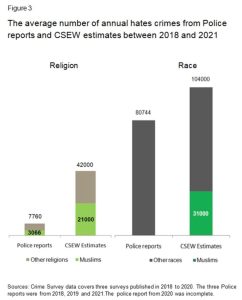
As illustrated on the left in Figure 3, for the Religion strand the ratio of the 3066 police reports to the 21000 CSEW estimate is around 1 in 7. This compares with a ratio of 1 in 4.5 (4694: 21000) for the other victims in this category.
Victim under-reporting, or police under-recording, seems more marked for Muslims under the strand of Religion than collectively for other religious groups. This leads to the 40% Muslim share for police reports for this period rising to 50% for the CSEW estimates.
If we then apply the same calculation for the 1.2% of Muslims victim to a hate crime motivated by Race, we have on the right in Figure 3 a total of 31 000 offences, taking a significant 30% share. But no data is given from Police reports under Race for a comparison.
We can see from Figure 3 that restricting the Police reports to the strand of Religion will greatly understate the true scale of Muslim hate crimes, but that the particular under-reporting or poor recording of religious hate crimes will also have a big impact.
The CSEW estimate of 21 000 religious and 31000 racial hate crimes gives a total of 52 000. This is 17 times greater than the 3066 in the Police reports.
In Figure 4 we compare the Muslim victim shares for the strands of Race and Religion.
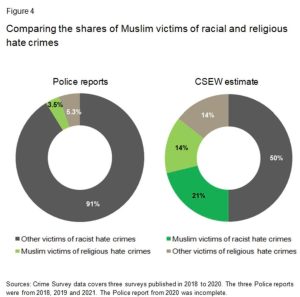
The 3.5% police report average three year share based solely on the Religion strand has increased to 14% for the CSEW estimation, as the strand itself increased in size as did the Muslim share.
The CSEW estimated Muslim share of the Race strand was 30%, and drops to 21% of both strands combined as shown above.
In total Muslim victims take a 35% share of the hate crimes motivated by Race and Religion, a ten-fold increase over Police report data.
Whilst accepting a significant margin of error in the CSEW estimates, we should also remember that the estimate of 52 000 anti-Muslim hate crimes does not cover all those covered in Police reports. It is difficult to quantify this, but victims under 16 may account for 15% of hate crimes, and those perceived to be Muslim but who are not 17% (see this TellMama Normalising Islamophobia Report) . Add to this restricted CSEW residential status and the poor cover of some public order offences, and we can appreciate that even the 52 000 estimate is likely to be a significant under-estimate.
The way forward
From the estimates presented here we can appreciate how Police reports grossly understate the scale of anti-Muslim hate crimes. There is a particular issue for Muslims concerning victim under-reporting or police staff recording. In addition, the omission of all Muslim data under the strand of Race misleads on both the scale and nature of anti-Muslim hate crimes.
Hate crime statistics help shape government policies, resource allocation and guide many organisations fighting all forms of prejudice that damage our society. Police reports should therefore, as officially advised, never be presented without qualification or CSEW context. Ultimately future Police reports should provide a breakdown of racial hate crimes by victim religion as well as ethnicity.
To combat anti-Muslim animosity effectively we need to take into account the two distinct forms of prejudice, one related to the religion of Islam and another to various ethno-cultural aspects of Muslim identity. There should be greater awareness that negative stereotypes for both have been shown to be ill-founded and unacceptable.
Importantly, the media and politicians need to publicly condemn those, including in their own ranks, who attempt to legitimise or normalise the anti-Muslim prejudices that motivate over a third of racist and religious hate crimes in our country. Otherwise they remain a part of a significant societal problem of anti-Muslim hate crimes and more widespread abuse and discrimination, when they should be part of the solution.













Comments are now closed.